Advanced temporal analysis and independent project implementation
Learning Objectives
By the end of this session, you will be able to:
Implement spatiotemporal analysis techniques for multi-temporal satellite imagery
Build time series models for change detection and trend analysis
Apply foundation models to temporal sequences of geospatial data
Design and begin executing your independent project
Evaluate model performance using appropriate spatiotemporal metrics
Prerequisites
This session builds on all previous weeks, particularly Week 5’s fine-tuning techniques. You should have defined your project proposal and be ready to begin implementation.
Spatiotemporal Data Fundamentals
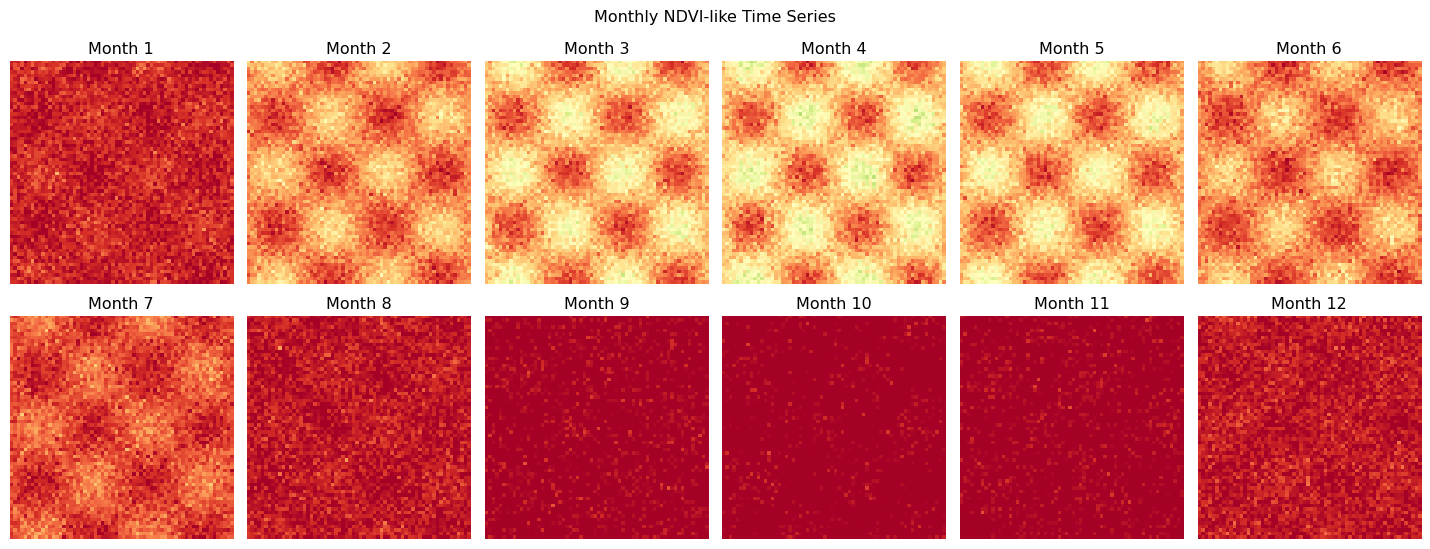
Spatiotemporal analysis combines spatial patterns with temporal dynamics to understand how geographic phenomena change over time. This is crucial for applications like:
Land cover change detection: Deforestation, urban expansion
This week marks the beginning of your independent project implementation. Use the frameworks and techniques demonstrated above to:
Implement your data pipeline using the temporal processing techniques
Adapt foundation models to your specific spatiotemporal task
Design evaluation metrics appropriate for your problem
Begin training and iteration on your project
Project Checklist
class ProjectChecklist:"""Checklist for Week 6 project implementation"""def__init__(self):self.checklist = {'data_pipeline': ['Data access and loading implemented','Temporal sequences properly formatted','Data augmentation strategy defined','Train/validation split established' ],'model_architecture': ['Base model architecture selected','Temporal processing method chosen','Model adaptations for project implemented','Parameter count and computational requirements assessed' ],'training_setup': ['Loss functions appropriate for task defined','Optimization strategy established','Training loop implemented','Checkpointing and model saving set up' ],'evaluation': ['Evaluation metrics selected and implemented','Baseline comparisons planned','Visualization strategy for results defined','Success criteria clearly established' ] }def display_checklist(self):"""Display the project checklist"""print("\\n=== Week 6 Project Implementation Checklist ===")for category, items inself.checklist.items():print(f"\\n{category.upper().replace('_', ' ')}:")for item in items:print(f" □ {item}")def mark_completed(self, category, item_index):"""Mark an item as completed"""if category inself.checklist:if0<= item_index <len(self.checklist[category]): item =self.checklist[category][item_index]self.checklist[category][item_index] =f"✓ {item[2:]}"# Display project checklistchecklist = ProjectChecklist()checklist.display_checklist()print("\\n=== Implementation Tips ===")tips = ["Start with simple temporal models before moving to complex architectures","Use synthetic data to validate your pipeline before applying to real data","Implement thorough logging and visualization for debugging","Consider computational constraints when designing temporal sequences","Plan for iterative development - start simple and add complexity gradually"]for i, tip inenumerate(tips, 1):print(f"{i}. {tip}")
\n=== Week 6 Project Implementation Checklist ===
\nDATA PIPELINE:
  □ Data access and loading implemented
  □ Temporal sequences properly formatted
  □ Data augmentation strategy defined
  □ Train/validation split established
\nMODEL ARCHITECTURE:
  □ Base model architecture selected
  □ Temporal processing method chosen
  □ Model adaptations for project implemented
  □ Parameter count and computational requirements assessed
\nTRAINING SETUP:
  □ Loss functions appropriate for task defined
  □ Optimization strategy established
  □ Training loop implemented
  □ Checkpointing and model saving set up
\nEVALUATION:
  □ Evaluation metrics selected and implemented
  □ Baseline comparisons planned
  □ Visualization strategy for results defined
  □ Success criteria clearly established
\n=== Implementation Tips ===
1. Start with simple temporal models before moving to complex architectures
2. Use synthetic data to validate your pipeline before applying to real data
3. Implement thorough logging and visualization for debugging
4. Consider computational constraints when designing temporal sequences
5. Plan for iterative development - start simple and add complexity gradually
Assignment: Project Implementation
Week 6 Deliverable
By the end of this week, have a working implementation of your project including:
Data Pipeline: Complete data loading and preprocessing
Model Implementation: Working model architecture for your task
Training Loop: Basic training procedure with loss tracking
Initial Results: Preliminary results and visualizations
Next Steps Plan: Clear plan for Week 7 optimization and scaling
Document your progress and any challenges encountered.
Next Week Preview
Week 7: Scale up your analysis using cloud platforms and advanced optimization
Week 8: Build deployment pipelines and comprehensive evaluation
Week 9: Final analysis, model comparison, and presentation preparation
Week 10: Final project presentations
The spatiotemporal modeling techniques and project framework from this week provide the foundation for implementing sophisticated geospatial AI applications that can handle the temporal dynamics crucial for real-world environmental monitoring and analysis.
Source Code
---title: "Week 6: Spatiotemporal Modeling & Projects"subtitle: "Advanced temporal analysis and independent project implementation"editor_options: chunk_output_type: consolejupyter: geoaiformat: html: toc: true toc-depth: 3---## Learning ObjectivesBy the end of this session, you will be able to:- Implement spatiotemporal analysis techniques for multi-temporal satellite imagery- Build time series models for change detection and trend analysis- Apply foundation models to temporal sequences of geospatial data- Design and begin executing your independent project- Evaluate model performance using appropriate spatiotemporal metrics:::{.callout-note}## PrerequisitesThis session builds on all previous weeks, particularly Week 5's fine-tuning techniques. You should have defined your project proposal and be ready to begin implementation.:::## Spatiotemporal Data FundamentalsSpatiotemporal analysis combines spatial patterns with temporal dynamics to understand how geographic phenomena change over time. This is crucial for applications like:- **Land cover change detection**: Deforestation, urban expansion- **Crop monitoring**: Growth stages, yield prediction- **Climate impact assessment**: Drought progression, flood mapping- **Environmental monitoring**: Water quality changes, vegetation health### Understanding Temporal Patterns```{python}import numpy as npimport pandas as pdimport matplotlib.pyplot as pltimport torchimport torch.nn as nnfrom torch.utils.data import Dataset, DataLoaderimport rasterioimport xarray as xrfrom datetime import datetime, timedeltaimport warningswarnings.filterwarnings('ignore')# Set up reproducible resultstorch.manual_seed(42)np.random.seed(42)class TemporalDataset(Dataset):"""Dataset for multi-temporal satellite imagery"""def__init__(self, n_samples=500, sequence_length=12, image_size=64):self.n_samples = n_samplesself.sequence_length = sequence_lengthself.image_size = image_size# Simulate monthly time series dataself.data =self._generate_synthetic_timeseries()def _generate_synthetic_timeseries(self):"""Generate synthetic time series with seasonal patterns""" data = []for i inrange(self.n_samples):# Create base landscape with some spatial structure base_landscape =self._create_landscape()# Generate temporal sequence with seasonal variation sequence = []for t inrange(self.sequence_length):# Seasonal factor (NDVI-like pattern) seasonal_factor =0.3+0.4* np.sin(2* np.pi * t /12)# Add some random change events change_factor =1.0if np.random.random() <0.1: # 10% chance of change change_factor = np.random.uniform(0.5, 1.5)# Combine factors image = base_landscape * seasonal_factor * change_factor# Add noise noise = np.random.normal(0, 0.05, image.shape) image = np.clip(image + noise, 0, 1) sequence.append(torch.FloatTensor(image)) data.append(torch.stack(sequence)) # Shape: (T, C, H, W)return datadef _create_landscape(self):"""Create a realistic base landscape"""# Start with random field landscape = np.random.random((3, self.image_size, self.image_size))# Add some spatial structure (vegetation patches) x, y = np.meshgrid(np.linspace(0, 1, self.image_size), np.linspace(0, 1, self.image_size))# Create vegetation patches vegetation =0.5+0.3* np.sin(4* np.pi * x) * np.cos(4* np.pi * y) vegetation = np.clip(vegetation, 0, 1)# Apply to NDVI-like band landscape[1] = vegetationreturn landscapedef__len__(self):returnself.n_samplesdef__getitem__(self, idx):returnself.data[idx]# Create temporal datasettemporal_dataset = TemporalDataset(n_samples=200, sequence_length=12)temporal_loader = DataLoader(temporal_dataset, batch_size=8, shuffle=True)print(f"Dataset size: {len(temporal_dataset)}")print(f"Data shape: {temporal_dataset[0].shape}") # (T, C, H, W)# Visualize a sample time seriessample_ts = temporal_dataset[0]fig, axes = plt.subplots(2, 6, figsize=(15, 6))for i inrange(12): row = i //6 col = i %6 axes[row, col].imshow(sample_ts[i, 1], cmap='RdYlGn', vmin=0, vmax=1) axes[row, col].set_title(f'Month {i+1}') axes[row, col].axis('off')plt.suptitle('Monthly NDVI-like Time Series')plt.tight_layout()plt.show()```## Temporal Foundation Models### LSTM-based Temporal Processing```{python}class TemporalLSTM(nn.Module):"""LSTM-based model for temporal sequence processing"""def__init__(self, input_dim, hidden_dim=128, num_layers=2, output_dim=None):super().__init__()self.input_dim = input_dimself.hidden_dim = hidden_dimself.num_layers = num_layersself.output_dim = output_dim or input_dim# Spatial feature extractorself.spatial_encoder = nn.Sequential( nn.Conv2d(3, 32, 3, padding=1), nn.ReLU(), nn.MaxPool2d(2), nn.Conv2d(32, 64, 3, padding=1), nn.ReLU(), nn.AdaptiveAvgPool2d(8), nn.Flatten(), nn.Linear(64*8*8, input_dim) )# Temporal LSTMself.lstm = nn.LSTM(input_dim, hidden_dim, num_layers, batch_first=True, dropout=0.1)# Output projectionself.output_head = nn.Sequential( nn.Linear(hidden_dim, hidden_dim), nn.ReLU(), nn.Dropout(0.1), nn.Linear(hidden_dim, self.output_dim) )def forward(self, x):# x: (B, T, C, H, W) batch_size, seq_len, c, h, w = x.shape# Process each timestep through spatial encoder x_flat = x.view(batch_size * seq_len, c, h, w) spatial_features =self.spatial_encoder(x_flat) # (B*T, input_dim) spatial_features = spatial_features.view(batch_size, seq_len, -1) # (B, T, input_dim)# Process temporal sequence lstm_out, (hidden, cell) =self.lstm(spatial_features)# Use final hidden state for prediction output =self.output_head(lstm_out[:, -1]) # (B, output_dim)return {'prediction': output,'temporal_features': lstm_out,'spatial_features': spatial_features }# Initialize modelmodel = TemporalLSTM(input_dim=256, hidden_dim=128)print(f"Model parameters: {sum(p.numel() for p in model.parameters()):,}")# Test forward passsample_batch =next(iter(temporal_loader))print(f"Input shape: {sample_batch.shape}")with torch.no_grad(): output = model(sample_batch)print(f"Prediction shape: {output['prediction'].shape}")print(f"Temporal features shape: {output['temporal_features'].shape}")```### Transformer-based Temporal Processing```{python}class TemporalTransformer(nn.Module):"""Transformer-based model for temporal sequence processing"""def__init__(self, input_dim=256, d_model=256, nhead=8, num_layers=4, output_dim=None):super().__init__()self.input_dim = input_dimself.d_model = d_modelself.output_dim = output_dim or input_dim# Spatial feature extractor (same as LSTM version)self.spatial_encoder = nn.Sequential( nn.Conv2d(3, 32, 3, padding=1), nn.ReLU(), nn.MaxPool2d(2), nn.Conv2d(32, 64, 3, padding=1), nn.ReLU(), nn.AdaptiveAvgPool2d(8), nn.Flatten(), nn.Linear(64*8*8, input_dim) )# Project to model dimensionself.input_projection = nn.Linear(input_dim, d_model)# Positional encoding for temporal positionsself.pos_encoding = nn.Parameter(torch.randn(100, d_model)) # Max 100 timesteps# Transformer encoder encoder_layer = nn.TransformerEncoderLayer( d_model=d_model, nhead=nhead, dim_feedforward=d_model *4, dropout=0.1, batch_first=True )self.transformer = nn.TransformerEncoder(encoder_layer, num_layers)# Output headself.output_head = nn.Sequential( nn.LayerNorm(d_model), nn.Linear(d_model, d_model), nn.ReLU(), nn.Dropout(0.1), nn.Linear(d_model, self.output_dim) )def forward(self, x):# x: (B, T, C, H, W) batch_size, seq_len, c, h, w = x.shape# Process spatial features x_flat = x.view(batch_size * seq_len, c, h, w) spatial_features =self.spatial_encoder(x_flat) spatial_features = spatial_features.view(batch_size, seq_len, -1)# Project to model dimension features =self.input_projection(spatial_features) # (B, T, d_model)# Add positional encoding features = features +self.pos_encoding[:seq_len].unsqueeze(0)# Apply transformer transformer_out =self.transformer(features) # (B, T, d_model)# Global average pooling across time pooled = transformer_out.mean(dim=1) # (B, d_model)# Output prediction output =self.output_head(pooled)return {'prediction': output,'temporal_features': transformer_out,'spatial_features': spatial_features }# Initialize transformer modeltransformer_model = TemporalTransformer(input_dim=256, d_model=256)print(f"Transformer parameters: {sum(p.numel() for p in transformer_model.parameters()):,}")# Test forward passwith torch.no_grad(): transformer_output = transformer_model(sample_batch)print(f"Transformer prediction shape: {transformer_output['prediction'].shape}")```## Change Detection Applications### Temporal Change Detection```{python}class ChangeDetector(nn.Module):"""Model for detecting changes in temporal sequences"""def__init__(self, backbone_model, num_classes=3):super().__init__()self.backbone = backbone_modelself.num_classes = num_classes # No change, Gradual change, Abrupt change# Get the output dimension from backbone output_dim = backbone_model.output_dim# Change classification headself.change_classifier = nn.Sequential( nn.Linear(output_dim, 128), nn.ReLU(), nn.Dropout(0.2), nn.Linear(128, num_classes) )# Change magnitude regressionself.magnitude_regressor = nn.Sequential( nn.Linear(output_dim, 64), nn.ReLU(), nn.Linear(64, 1), nn.Sigmoid() # Output between 0 and 1 )def forward(self, x):# Get features from backbone backbone_out =self.backbone(x) features = backbone_out['prediction']# Classify change type change_type =self.change_classifier(features)# Predict change magnitude change_magnitude =self.magnitude_regressor(features)return {'change_type': change_type,'change_magnitude': change_magnitude,'features': features,'backbone_output': backbone_out }# Create change detection modelchange_detector = ChangeDetector(transformer_model, num_classes=3)# Create training data with change labelsdef create_change_labels(temporal_data):"""Create synthetic change labels for training""" batch_size, seq_len, c, h, w = temporal_data.shape change_types = [] change_magnitudes = []for i inrange(batch_size):# Analyze temporal progression sequence = temporal_data[i, :, 1] # Use vegetation band# Calculate temporal variance as proxy for change temporal_var = torch.var(sequence.flatten(1), dim=1).mean()# Classify change type based on varianceif temporal_var <0.01: change_type =0# No change magnitude =0.0elif temporal_var <0.05: change_type =1# Gradual change magnitude =float(temporal_var /0.05)else: change_type =2# Abrupt change magnitude =min(1.0, float(temporal_var /0.1)) change_types.append(change_type) change_magnitudes.append(magnitude)return torch.LongTensor(change_types), torch.FloatTensor(change_magnitudes).unsqueeze(1)# Test change detectionwith torch.no_grad(): change_output = change_detector(sample_batch) change_types, change_mags = create_change_labels(sample_batch)print(f"Change type predictions: {change_output['change_type'].shape}")print(f"Change magnitude predictions: {change_output['change_magnitude'].shape}")print(f"Sample change types: {change_types[:5]}")print(f"Sample change magnitudes: {change_mags[:5, 0]}")```### Training Change Detection Model```{python}import torch.optim as optimfrom torch.nn import CrossEntropyLoss, MSELossclass ChangeDetectionTrainer:"""Trainer for change detection models"""def__init__(self, model, device='cpu'):self.model = model.to(device)self.device = device# Loss functionsself.classification_loss = CrossEntropyLoss()self.regression_loss = MSELoss()# Optimizerself.optimizer = optim.AdamW(model.parameters(), lr=1e-4, weight_decay=0.01)# Training historyself.history = {'train_loss': [],'val_loss': [],'classification_acc': [],'regression_mae': [] }def train_epoch(self, dataloader):"""Train for one epoch"""self.model.train() total_loss =0 correct_classifications =0 total_samples =0 total_mae =0for batch_idx, data inenumerate(dataloader): data = data.to(self.device)# Generate labels change_types, change_mags = create_change_labels(data) change_types = change_types.to(self.device) change_mags = change_mags.to(self.device)# Forward pass output =self.model(data)# Calculate losses class_loss =self.classification_loss(output['change_type'], change_types) reg_loss =self.regression_loss(output['change_magnitude'], change_mags)# Combined loss total_batch_loss = class_loss + reg_loss# Backward passself.optimizer.zero_grad() total_batch_loss.backward()self.optimizer.step()# Statistics total_loss += total_batch_loss.item() pred_classes = output['change_type'].argmax(dim=1) correct_classifications += (pred_classes == change_types).sum().item() total_samples += change_types.size(0)# MAE for regression mae = torch.abs(output['change_magnitude'] - change_mags).mean().item() total_mae += mae avg_loss = total_loss /len(dataloader) classification_acc = correct_classifications / total_samples avg_mae = total_mae /len(dataloader)return avg_loss, classification_acc, avg_maedef fit(self, train_loader, val_loader=None, epochs=10):"""Complete training procedure"""print("Training change detection model...")for epoch inrange(epochs):# Train train_loss, train_acc, train_mae =self.train_epoch(train_loader)# Validate (using training data for demo) val_loss, val_acc, val_mae = train_loss, train_acc, train_mae# Store historyself.history['train_loss'].append(train_loss)self.history['val_loss'].append(val_loss)self.history['classification_acc'].append(train_acc)self.history['regression_mae'].append(train_mae)print(f"Epoch {epoch+1:2d}/{epochs} | "f"Loss: {train_loss:.4f} | "f"Acc: {train_acc:.3f} | "f"MAE: {train_mae:.4f}")returnself.history# Train the modeltrainer = ChangeDetectionTrainer(change_detector)history = trainer.fit(temporal_loader, epochs=5)# Plot training curvesfig, (ax1, ax2, ax3) = plt.subplots(1, 3, figsize=(15, 4))ax1.plot(history['train_loss'], label='Train Loss')ax1.set_title('Training Loss')ax1.set_xlabel('Epoch')ax1.legend()ax1.grid(True, alpha=0.3)ax2.plot(history['classification_acc'], label='Classification Accuracy')ax2.set_title('Classification Accuracy')ax2.set_xlabel('Epoch')ax2.legend()ax2.grid(True, alpha=0.3)ax3.plot(history['regression_mae'], label='Regression MAE')ax3.set_title('Magnitude Prediction MAE')ax3.set_xlabel('Epoch')ax3.legend()ax3.grid(True, alpha=0.3)plt.tight_layout()plt.show()```## Foundation Model Integration### Adapting Pretrained Models for Temporal Analysis```{python}class FoundationModelTemporal(nn.Module):"""Adapter for using foundation models with temporal data"""def__init__(self, foundation_model, temporal_fusion='attention'):super().__init__()self.foundation_model = foundation_modelself.temporal_fusion = temporal_fusion# Assume foundation model outputs 768-dim featuresself.feature_dim =768if temporal_fusion =='attention':self.temporal_attention = nn.MultiheadAttention( embed_dim=self.feature_dim, num_heads=8, batch_first=True )elif temporal_fusion =='lstm':self.temporal_lstm = nn.LSTM( input_size=self.feature_dim, hidden_size=self.feature_dim, num_layers=2, batch_first=True )elif temporal_fusion =='transformer': encoder_layer = nn.TransformerEncoderLayer( d_model=self.feature_dim, nhead=8, batch_first=True )self.temporal_transformer = nn.TransformerEncoder(encoder_layer, num_layers=3)# Final classification/regression headsself.classifier = nn.Linear(self.feature_dim, 10) # 10 land cover classesdef forward(self, x):# x: (B, T, C, H, W) batch_size, seq_len, c, h, w = x.shape# Process each timestep through foundation model temporal_features = []for t inrange(seq_len):# Extract features for timestep twith torch.no_grad(): # Foundation model frozen feat =self.foundation_model(x[:, t]) # (B, feature_dim) temporal_features.append(feat)# Stack temporal features temporal_features = torch.stack(temporal_features, dim=1) # (B, T, feature_dim)# Apply temporal fusionifself.temporal_fusion =='attention': fused_features, _ =self.temporal_attention( temporal_features, temporal_features, temporal_features )# Use last timestep output_features = fused_features[:, -1]elifself.temporal_fusion =='lstm': lstm_out, _ =self.temporal_lstm(temporal_features) output_features = lstm_out[:, -1]elifself.temporal_fusion =='transformer': transformer_out =self.temporal_transformer(temporal_features) output_features = transformer_out.mean(dim=1) # Global average poolingelse: # Simple averaging output_features = temporal_features.mean(dim=1)# Final prediction prediction =self.classifier(output_features)return {'prediction': prediction,'temporal_features': temporal_features,'fused_features': output_features }# Mock foundation model for demonstrationclass MockFoundationModel(nn.Module):def__init__(self):super().__init__()self.backbone = nn.Sequential( nn.Conv2d(3, 64, 7, stride=2, padding=3), nn.ReLU(), nn.AdaptiveAvgPool2d(1), nn.Flatten(), nn.Linear(64, 768) )def forward(self, x):returnself.backbone(x)# Create foundation model with temporal adaptationfoundation_base = MockFoundationModel()temporal_foundation = FoundationModelTemporal(foundation_base, temporal_fusion='attention')print(f"Temporal foundation model parameters: {sum(p.numel() for p in temporal_foundation.parameters()):,}")# Test with temporal datawith torch.no_grad(): foundation_output = temporal_foundation(sample_batch)print(f"Foundation model output shape: {foundation_output['prediction'].shape}")print(f"Temporal features shape: {foundation_output['temporal_features'].shape}")```## Project Implementation Framework### Project Structure Template```{python}class ProjectFramework:"""Framework for implementing independent projects"""def__init__(self, project_config):self.config = project_configself.model =Noneself.data_loader =Noneself.trainer =Nonedef setup_data(self):"""Setup project-specific data pipeline"""print(f"Setting up data for: {self.config['title']}")# This would be customized for each projectifself.config['data_type'] =='time_series':self.data_loader =self._setup_temporal_data()elifself.config['data_type'] =='static':self.data_loader =self._setup_static_data()else:raiseValueError(f"Unknown data type: {self.config['data_type']}")returnself.data_loaderdef _setup_temporal_data(self):"""Setup temporal data pipeline"""# For demonstration, use our temporal datasetreturn DataLoader(temporal_dataset, batch_size=self.config['batch_size'], shuffle=True)def _setup_static_data(self):"""Setup static data pipeline"""# Placeholder for static image datareturnNonedef setup_model(self):"""Setup project-specific model"""print(f"Setting up model for: {self.config['model_type']}")ifself.config['model_type'] =='temporal_transformer':self.model = TemporalTransformer(**self.config['model_params'])elifself.config['model_type'] =='temporal_lstm':self.model = TemporalLSTM(**self.config['model_params'])elifself.config['model_type'] =='foundation_temporal': base_model = MockFoundationModel()self.model = FoundationModelTemporal(base_model, **self.config['model_params'])else:raiseValueError(f"Unknown model type: {self.config['model_type']}")returnself.modeldef setup_training(self):"""Setup training procedure"""ifself.config['task_type'] =='change_detection':# Wrap the base model in a ChangeDetector change_detection_model = ChangeDetector(self.model, num_classes=3)self.trainer = ChangeDetectionTrainer(change_detection_model)else:# Generic trainer (would be implemented)self.trainer =Nonereturnself.trainerdef run_experiment(self):"""Run the complete experiment"""print(f"\\nRunning experiment: {self.config['title']}")print("="*50)# Setup components data_loader =self.setup_data() model =self.setup_model() trainer =self.setup_training()# Run training if trainer availableif trainer: history = trainer.fit(data_loader, epochs=self.config['epochs'])return historyelse:print("No trainer available - would implement project-specific training")returnNone# Example project configurationsproject_configs = {'crop_monitoring': {'title': 'Crop Growth Monitoring','data_type': 'time_series','model_type': 'temporal_transformer','task_type': 'change_detection','batch_size': 8,'epochs': 5,'model_params': {'input_dim': 256,'d_model': 256,'nhead': 8,'num_layers': 4 } },'deforestation_detection': {'title': 'Deforestation Detection','data_type': 'time_series','model_type': 'foundation_temporal','task_type': 'change_detection','batch_size': 4,'epochs': 3,'model_params': {'temporal_fusion': 'attention' } }}# Demonstrate project frameworkproject = ProjectFramework(project_configs['crop_monitoring'])history = project.run_experiment()if history:print("\\nTraining completed successfully!")print(f"Final accuracy: {history['classification_acc'][-1]:.3f}")```## Evaluation Metrics for Spatiotemporal Models### Temporal-Aware Metrics```{python}class SpatiotemporalMetrics:"""Comprehensive metrics for spatiotemporal model evaluation"""@staticmethoddef temporal_consistency(predictions, ground_truth):"""Measure temporal consistency of predictions"""# predictions, ground_truth: (B, T, ...)# Calculate temporal gradients pred_gradients = torch.diff(predictions, dim=1) gt_gradients = torch.diff(ground_truth, dim=1)# Consistency score consistency =1- torch.mean(torch.abs(pred_gradients - gt_gradients))return consistency.item()@staticmethoddef change_detection_metrics(pred_change_type, pred_change_mag, true_change_type, true_change_mag):"""Metrics specific to change detection"""# Classification metrics correct_classifications = (pred_change_type == true_change_type).float() classification_accuracy = correct_classifications.mean().item()# Regression metrics for magnitude mae = torch.mean(torch.abs(pred_change_mag - true_change_mag)).item() rmse = torch.sqrt(torch.mean((pred_change_mag - true_change_mag) **2)).item()return {'classification_accuracy': classification_accuracy,'magnitude_mae': mae,'magnitude_rmse': rmse }@staticmethoddef spatial_autocorrelation(predictions, ground_truth):"""Measure spatial autocorrelation preservation"""# Simplified version - would use proper spatial statistics in practicedef moran_i_approx(data):"""Approximate Moran's I calculation"""# This is a simplified version mean_val = torch.mean(data) numerator = torch.sum((data - mean_val) **2)return numerator / (data.numel() * torch.var(data)) pred_moran = moran_i_approx(predictions) gt_moran = moran_i_approx(ground_truth)# How well do we preserve spatial structure? preservation =1- torch.abs(pred_moran - gt_moran)return preservation.item()# Demonstrate evaluation metricswith torch.no_grad():# Generate some test predictions test_batch =next(iter(temporal_loader)) change_output = change_detector(test_batch) true_types, true_mags = create_change_labels(test_batch) pred_types = change_output['change_type'].argmax(dim=1) pred_mags = change_output['change_magnitude']# Calculate metrics metrics = SpatiotemporalMetrics() change_metrics = metrics.change_detection_metrics( pred_types, pred_mags, true_types, true_mags )print("\\n=== Spatiotemporal Evaluation Metrics ===")print(f"Classification Accuracy: {change_metrics['classification_accuracy']:.3f}")print(f"Magnitude MAE: {change_metrics['magnitude_mae']:.4f}")print(f"Magnitude RMSE: {change_metrics['magnitude_rmse']:.4f}")# Temporal consistency (using synthetic data) temp_consistency = metrics.temporal_consistency(test_batch[:, :-1], test_batch[:, 1:])print(f"Temporal Consistency: {temp_consistency:.3f}")```## Week 6 Project Workshop:::{.callout-tip}## Project Implementation PhaseThis week marks the beginning of your independent project implementation. Use the frameworks and techniques demonstrated above to:1. **Implement your data pipeline** using the temporal processing techniques2. **Adapt foundation models** to your specific spatiotemporal task3. **Design evaluation metrics** appropriate for your problem4. **Begin training and iteration** on your project:::### Project Checklist```{python}class ProjectChecklist:"""Checklist for Week 6 project implementation"""def__init__(self):self.checklist = {'data_pipeline': ['Data access and loading implemented','Temporal sequences properly formatted','Data augmentation strategy defined','Train/validation split established' ],'model_architecture': ['Base model architecture selected','Temporal processing method chosen','Model adaptations for project implemented','Parameter count and computational requirements assessed' ],'training_setup': ['Loss functions appropriate for task defined','Optimization strategy established','Training loop implemented','Checkpointing and model saving set up' ],'evaluation': ['Evaluation metrics selected and implemented','Baseline comparisons planned','Visualization strategy for results defined','Success criteria clearly established' ] }def display_checklist(self):"""Display the project checklist"""print("\\n=== Week 6 Project Implementation Checklist ===")for category, items inself.checklist.items():print(f"\\n{category.upper().replace('_', ' ')}:")for item in items:print(f" □ {item}")def mark_completed(self, category, item_index):"""Mark an item as completed"""if category inself.checklist:if0<= item_index <len(self.checklist[category]): item =self.checklist[category][item_index]self.checklist[category][item_index] =f"✓ {item[2:]}"# Display project checklistchecklist = ProjectChecklist()checklist.display_checklist()print("\\n=== Implementation Tips ===")tips = ["Start with simple temporal models before moving to complex architectures","Use synthetic data to validate your pipeline before applying to real data","Implement thorough logging and visualization for debugging","Consider computational constraints when designing temporal sequences","Plan for iterative development - start simple and add complexity gradually"]for i, tip inenumerate(tips, 1):print(f"{i}. {tip}")```## Assignment: Project Implementation:::{.callout-note}## Week 6 DeliverableBy the end of this week, have a working implementation of your project including:1. **Data Pipeline**: Complete data loading and preprocessing2. **Model Implementation**: Working model architecture for your task3. **Training Loop**: Basic training procedure with loss tracking4. **Initial Results**: Preliminary results and visualizations5. **Next Steps Plan**: Clear plan for Week 7 optimization and scalingDocument your progress and any challenges encountered.:::### Next Week Preview- **Week 7**: Scale up your analysis using cloud platforms and advanced optimization- **Week 8**: Build deployment pipelines and comprehensive evaluation- **Week 9**: Final analysis, model comparison, and presentation preparation- **Week 10**: Final project presentationsThe spatiotemporal modeling techniques and project framework from this week provide the foundation for implementing sophisticated geospatial AI applications that can handle the temporal dynamics crucial for real-world environmental monitoring and analysis.